


At Discord, we want the experience of chatting with your friends, reacting to a message, or posting artisanal farm-to-channel memes to feel instantaneous. We’ve managed to achieve this at scale by leveraging Elixir’s powerful concurrency mechanisms to run each Discord server (which we call a “guild” internally) fully independently from one another.
Sometimes though, things go wrong, and a guild can’t keep up with its user activity. When this happens, the guild will feel laggy or possibly experience a complete outage. If the system degrades beyond the point it can self-heal, an on-call engineer has to intervene. Afterwards, they turn to our observability tools to understand the cause and how to stop it from recurring.
Our on-call engineer’s investigation begins by looking at metrics and logs. We have a wide array of instrumentation, including measurements of how frequently we process each user action type and how long processing takes. These often provide useful hints about bursty activity, like a flurry of hype and reactions on that sweet new game that just got shadow-dropped, but even if we find an inciting event, it’s tricky to gauge what the experience was for users. Think of it like your car’s dashboard: it can tell you what the engine temperature is, but not the consequences of it running hot.
If that doesn’t yield results, the on-call engineer turns to our custom-built tool called “guild timings.” Every time a guild processes an action, it records how much of the current minute has been spent on each action type to an in-memory store. This data is much more detailed than our metrics, but it’s emitted at such a high volume that we can’t feasibly store it all. As such, this data is rotated frequently for all but our largest guilds. Even if we retrieve the data in time, it still won’t give us a good picture of the end-to-end experience, as it doesn’t capture downstream effects.
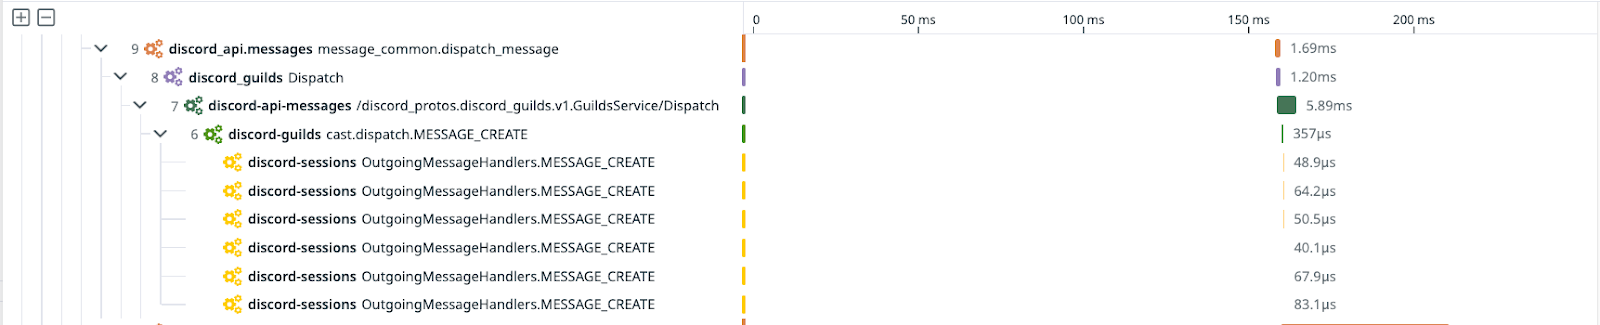
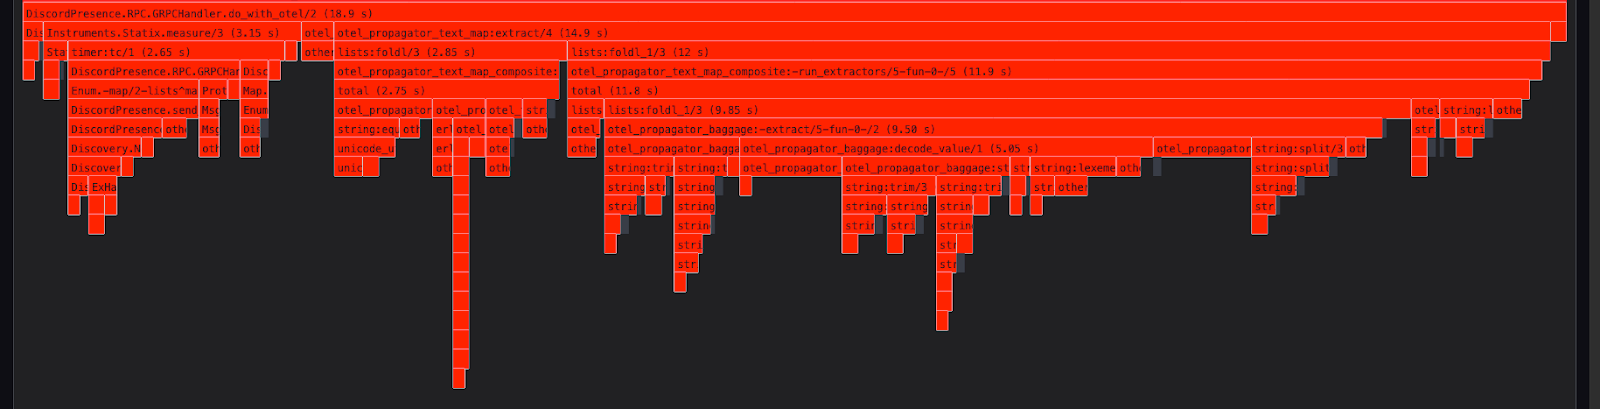
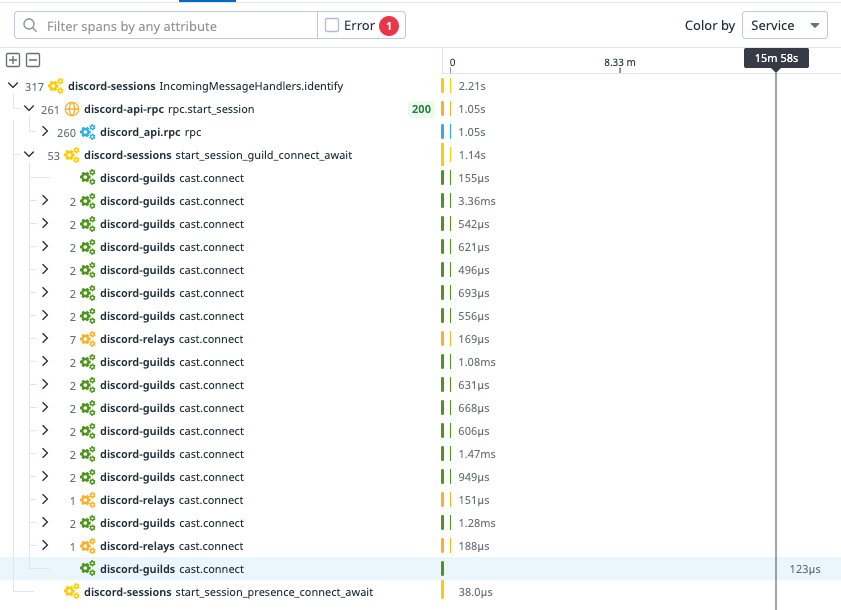
Other teams at Discord have derived enormous value from utilizing distributed tracing (a.k.a. Application Performance Monitoring), which allows them to see how long the constituent parts of an operation took. Adding tracing to our Elixir stack took a bit of work, though. Most tracing tools work by passing information about the operation via metadata layers like HTTP headers, but Elixir’s built-in communication tools don’t have an equivalent layer out of the box.
So… we had to build our own. Despite the fact that we were changing how our services communicate with one another, we managed to integrate it without downtime.


.png)
.png)


Nameplates_BlogBanner_AB_FINAL_V1.png)


_Blog_Banner_Static_Final_1800x720.png)


_MKT_01_Blog%20Banner_Full.jpg)


.png)


.png)


